
Percentage of Food Budget the Average Australian Family Spent on Restaurant Meals - Task
- IELTS Luminary

- Feb 15, 2024
- 4 min read
You should spend about 20 minutes on this task.
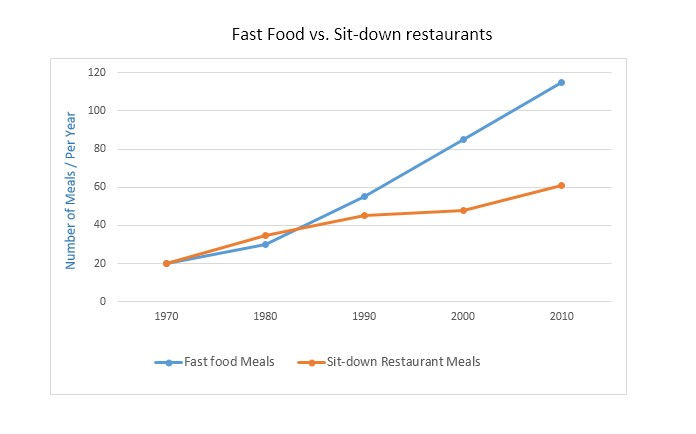
The charts below show the percentage of food budget the average Australian family spent on restaurant meals in different years. The graph shows the number of meals eaten in fast food restaurants and sit-down restaurants.
Summarise the information by selecting and reporting the main features, and make comparisons where relevant.
Write at least 150 words.

Download IELTS eBooks, get everything you need to achieve a high band score
Model Answer 1
The illustrations presented offer a compelling visual summary of the evolving dining preferences of the average Australian family, with a specific focus on the proportion of their food budget allocated to restaurant meals over a forty-year period. Additionally, these graphics shed light on the comparative frequency of meals consumed at fast food outlets versus traditional sit-down restaurants.
An overview of the pie charts indicates a substantial shift in spending habits, with a mere 15% of the food budget being devoted to restaurant meals in 1980, which then ballooned to a dominant 60% by 2010. This marks a noteworthy transition in culinary trends, as families increasingly favoured the convenience of dining out over home-cooked meals.
Delving into the details, the line graph illustrates an initial parity in 1970, with both fast food and sit-down restaurants equally serving around 20 meals per annum to the average Australian. However, over the subsequent decades, a clear preference for fast food emerged. By 2010, the average fast food consumption soared past 110 annual meals, whereas sit-down restaurant meals exhibited a more moderate increase, reaching just over 60. This divergence underscores the burgeoning appeal of fast food's quick and accessible dining experience compared to the more traditional sit-down venues.
Download IELTS eBooks, get everything you need to achieve a high band score
Model Answer 2
The provided data articulately outlines the changing dynamics in the food budget the average Australian family spent on restaurant meals, contrasted against home cooking expenditures, alongside a depiction of the frequency of meals consumed at fast food and sit-down restaurants from 1970 to 2010.
The overarching trend captured by the data is a pronounced shift towards dining out. In 1980, a modest fraction of the food budget was allotted to restaurant dining; by 2010, the scales tipped markedly, with the majority of the budget directed to eateries outside the home. Concurrently, a surge in fast food consumption was documented, outpacing that of sit-down restaurants significantly.
In finer detail, the pie charts from 1980 show a dominant preference for home-cooked meals, comprising 85% of the food budget. Fast forward to 2010, and this preference is reversed, with 60% of the budget now favouring restaurant fare. The line graphs echo this sentiment, initially indicating an equal preference for fast food and sit-down restaurants, with both at 20 meals per year in 1970. Over the next 40 years, fast food meals experience a steep ascent, exceeding 110 meals per year, while sit-down restaurants see a more modest rise, at just above 60 meals annually.
Model Answer 3
The provided visual data encapsulates trends in the food budget the average Australian family spent on restaurant meals as compared to home cooking, alongside the frequency of dining at fast food versus sit-down restaurants from 1970 to 2010.
Evidently, there has been a dramatic shift in dining preferences over the four decades. Initially, home-cooked meals dominated the family food budget, but a surge in restaurant dining is notable, with a striking incline towards fast food consumption.
The pie charts illustrate a modest 15% of the food budget was allocated to restaurant dining in 1980, which saw a steady rise in subsequent decades, culminating at 60% by 2010. This indicates a quadrupling of expenditure on dining out in a span of 30 years. Concurrently, the line graph reflects a parallel trend in the number of meals consumed outside the home. While both restaurant types saw an increase, fast food outlets experienced a meteoric rise in patronage, with the number of meals skyrocketing from 20 to approximately 120 per year, dwarfing the growth seen in sit-down restaurant meals, which only slightly more than doubled in the same timeframe.
Model Answer 4
The illustrative materials present a comprehensive analysis of the food budget the average Australian family spent on restaurant meals over a span of 40 years, juxtaposed with the quantified preferences for fast food versus traditional sit-down restaurants.
From an overarching perspective, the trend lines and pie segments unveil a pronounced escalation in the proportion of dining out expenses, coupled with a marked predilection for fast food consumption that overshadows sit-down establishments by a significant margin.
Delving into specifics, the 1980s pie chart reveals a modest 15% of the food budget dedicated to eating out. This figure surged to 35% in the subsequent decade. By the turn of the millennium, Australians were apportioning half of their food budget to restaurant meals, which further ballooned to 60% by 2010, showcasing a fourfold increase from 1980. The line graph corroborates this trend, depicting a steep ascent in fast food meal frequency from a mere 20 meals per annum in 1970 to an astounding 120 by 2010. In contrast, sit-down restaurant meals also grew, but at a more measured pace, merely doubling from the 1970 benchmark to just over 60 meals by 2010.


